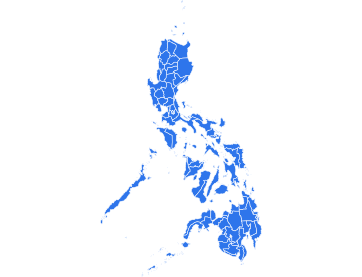
Philippines: Archipelagic Trade Hub in Southeast Asia
Nestled in Southeast Asia, the Philippines emerges as a maritime crossroads with a diverse economic landscape. As of 2024, it ranked 34 globally in GDP, reflecting a resilient and growing economy shaped by its geographical advantages.
Introduction:
The Philippines, a rapidly growing Southeast Asian economy, heavily relies on imports to fuel its development. Key import sectors include electronics, machinery, and consumer goods, which are crucial for supporting its expansive manufacturing base and the demands of its increasing population.
Economic Overview:
As one of the fastest-growing economies in Asia, the Philippines has a diverse industrial base with a significant emphasis on electronics, outsourcing, and remittances. Imports are vital for supplying raw materials and capital goods needed for its manufacturing sectors, impacting significantly on GDP. The country is actively seeking to diversify its economy to reduce dependency on imports.
Political and Regulatory Environment:
The Philippines maintains a democratic political system with active participation in international trade agreements, which influences its trade policies and economic stability. Recent legislative changes aim to enhance business processes and encourage foreign investment, impacting import dynamics.
Opportunities and Challenges for Exporters:
Exporters can find lucrative opportunities in supplying electronic components, agricultural machinery, and renewable energy technology. However, challenges include navigating a complex regulatory environment and adapting to local market preferences.
Positives:
1. Archipelagic Gateway: As an archipelago, the Philippines serves as a maritime gateway, connecting trade routes in the Pacific and facilitating international trade.
2. BPO Industry: The booming Business Process Outsourcing 2025 sector contributes significantly to the services trade, attracting foreign investments and creating jobs.
3. Young Workforce: A young and English-speaking workforce enhances the country's competitiveness in global trade and services.
Negatives:
1. Natural Disasters: Vulnerability to typhoons and earthquakes poses risks to infrastructure and disrupts trade activities.
2. Infrastructure Gaps: Despite improvements, certain areas still face challenges in infrastructure development, impacting trade efficiency.
3. Income Inequality: Disparities in wealth distribution may pose social challenges and affect long-term stability.
Philippines import export data
, including buyer and supplier names, is available on the Volza Platform.
In July 2024, Philippines ranked 26th in global
imports, with imports valued at 77.78 billion, representing a -15% growth from July 2023.
From July 2024 to July 2025, the country's imports amounted to US$269.1 billion, showing a 23% growth from the preceding year.
In 2025, imports totaled 77.78 billion, marking a -46% YOY growth from 2024. Sources of these imports were
China, Indonesia, Japan, USA, Rep. of Korea, Thailand, Singapore, Malaysia, Viet Na. Imported products were
Electrical machinery and equipment, Mineral fuels and oils, Machinery and equipment, other than railway or tramway. Suppliers were
NISSAN PHILIPPINES INC,
SUZUKI PHILLIPHINES INCORPORATED,
and
KAWASAKI MOTORS CORP LTD.
Importers in Philippines were
China: 22.7%, Indonesia: 9.3%, and Japan: 8.3%.
Top 10 Import Products:
- Electronic products (HS code: 8542) - Semiconductors, essential for local assembly lines.
- Petroleum oils (HS code: 2709) - For energy and transportation.
- Machinery and mechanical appliances (HS code: 8479) - For manufacturing and processing.
- Vehicles (HS code: 8703) - Growing demand in automotive sectors.
- Iron and steel (HS code: 7201) - Infrastructure projects.
- Plastics (HS code: 3901) - Wide use in manufacturing.
- Pharmaceuticals (HS code: 3004) - Healthcare sector supplies.
- Cereals (HS code: 1001) - Food staple, especially rice.
- Clothing (HS code: 6203) - Retail and consumer markets.
- Optical, photographic (HS code: 9001) - Technology and media sectors.
FLEXI COMPONENTS, SUEZ WATER TECHNOLOGIES AND SOLUTIONS INDONESIA, WOOK GLOBAL TECHNOLOGY
Solution for Global Exporters:
Global exporters should leverage Volza’s online import data for the Philippines to navigate this vibrant market effectively. Volza offers real-time insights into import trends and market demands, facilitating strategic planning and competitive positioning. Visit Volza for detailed analytics to maximize trade opportunities.


%22%3E%3Cg%20transform%3D%22translate(0%2C230)%22%20fill%3D%22none%22%20font-size%3D%2210%22%20font-family%3D%22sans-serif%22%20text-anchor%3D%22middle%22%3E%3Cpath%20class%3D%22domain%22%20stroke%3D%22currentColor%22%20d%3D%22M0.5%2C6V0.5H370.5V6%22%3E%3C%2Fpath%3E%3Cg%20class%3D%22tick%22%20opacity%3D%221%22%20transform%3D%22translate(0.5%2C0)%22%3E%3Cline%20stroke%3D%22currentColor%22%20y2%3D%226%22%3E%3C%2Fline%3E%3Ctext%20fill%3D%22currentColor%22%20y%3D%229%22%20dy%3D%220.71em%22%3EJan%3C%2Ftext%3E%3C%2Fg%3E%3Cg%20class%3D%22tick%22%20opacity%3D%221%22%20transform%3D%22translate(34.13636363636364%2C0)%22%3E%3Cline%20stroke%3D%22currentColor%22%20y2%3D%226%22%3E%3C%2Fline%3E%3Ctext%20fill%3D%22currentColor%22%20y%3D%229%22%20dy%3D%220.71em%22%3EFeb%3C%2Ftext%3E%3C%2Fg%3E%3Cg%20class%3D%22tick%22%20opacity%3D%221%22%20transform%3D%22translate(67.77272727272728%2C0)%22%3E%3Cline%20stroke%3D%22currentColor%22%20y2%3D%226%22%3E%3C%2Fline%3E%3Ctext%20fill%3D%22currentColor%22%20y%3D%229%22%20dy%3D%220.71em%22%3EMar%3C%2Ftext%3E%3C%2Fg%3E%3Cg%20class%3D%22tick%22%20opacity%3D%221%22%20transform%3D%22translate(101.4090909090909%2C0)%22%3E%3Cline%20stroke%3D%22currentColor%22%20y2%3D%226%22%3E%3C%2Fline%3E%3Ctext%20fill%3D%22currentColor%22%20y%3D%229%22%20dy%3D%220.71em%22%3EApr%3C%2Ftext%3E%3C%2Fg%3E%3Cg%20class%3D%22tick%22%20opacity%3D%221%22%20transform%3D%22translate(135.04545454545456%2C0)%22%3E%3Cline%20stroke%3D%22currentColor%22%20y2%3D%226%22%3E%3C%2Fline%3E%3Ctext%20fill%3D%22currentColor%22%20y%3D%229%22%20dy%3D%220.71em%22%3EMay%3C%2Ftext%3E%3C%2Fg%3E%3Cg%20class%3D%22tick%22%20opacity%3D%221%22%20transform%3D%22translate(168.6818181818182%2C0)%22%3E%3Cline%20stroke%3D%22currentColor%22%20y2%3D%226%22%3E%3C%2Fline%3E%3Ctext%20fill%3D%22currentColor%22%20y%3D%229%22%20dy%3D%220.71em%22%3EJun%3C%2Ftext%3E%3C%2Fg%3E%3Cg%20class%3D%22tick%22%20opacity%3D%221%22%20transform%3D%22translate(202.3181818181818%2C0)%22%3E%3Cline%20stroke%3D%22currentColor%22%20y2%3D%226%22%3E%3C%2Fline%3E%3Ctext%20fill%3D%22currentColor%22%20y%3D%229%22%20dy%3D%220.71em%22%3EJul%3C%2Ftext%3E%3C%2Fg%3E%3Cg%20class%3D%22tick%22%20opacity%3D%221%22%20transform%3D%22translate(235.95454545454544%2C0)%22%3E%3Cline%20stroke%3D%22currentColor%22%20y2%3D%226%22%3E%3C%2Fline%3E%3Ctext%20fill%3D%22currentColor%22%20y%3D%229%22%20dy%3D%220.71em%22%3EAug%3C%2Ftext%3E%3C%2Fg%3E%3Cg%20class%3D%22tick%22%20opacity%3D%221%22%20transform%3D%22translate(269.5909090909091%2C0)%22%3E%3Cline%20stroke%3D%22currentColor%22%20y2%3D%226%22%3E%3C%2Fline%3E%3Ctext%20fill%3D%22currentColor%22%20y%3D%229%22%20dy%3D%220.71em%22%3ESep%3C%2Ftext%3E%3C%2Fg%3E%3Cg%20class%3D%22tick%22%20opacity%3D%221%22%20transform%3D%22translate(303.22727272727275%2C0)%22%3E%3Cline%20stroke%3D%22currentColor%22%20y2%3D%226%22%3E%3C%2Fline%3E%3Ctext%20fill%3D%22currentColor%22%20y%3D%229%22%20dy%3D%220.71em%22%3EOct%3C%2Ftext%3E%3C%2Fg%3E%3Cg%20class%3D%22tick%22%20opacity%3D%221%22%20transform%3D%22translate(336.8636363636364%2C0)%22%3E%3Cline%20stroke%3D%22currentColor%22%20y2%3D%226%22%3E%3C%2Fline%3E%3Ctext%20fill%3D%22currentColor%22%20y%3D%229%22%20dy%3D%220.71em%22%3ENov%3C%2Ftext%3E%3C%2Fg%3E%3Cg%20class%3D%22tick%22%20opacity%3D%221%22%20transform%3D%22translate(370.5%2C0)%22%3E%3Cline%20stroke%3D%22currentColor%22%20y2%3D%226%22%3E%3C%2Fline%3E%3Ctext%20fill%3D%22currentColor%22%20y%3D%229%22%20dy%3D%220.71em%22%3EDec%3C%2Ftext%3E%3C%2Fg%3E%3C%2Fg%3E%3Cg%20fill%3D%22none%22%20font-size%3D%2210%22%20font-family%3D%22sans-serif%22%20text-anchor%3D%22end%22%3E%3Cpath%20class%3D%22domain%22%20stroke%3D%22currentColor%22%20d%3D%22M-6%2C230.5H0.5V0.5H-6%22%3E%3C%2Fpath%3E%3Cg%20class%3D%22tick%22%20opacity%3D%221%22%20transform%3D%22translate(0%2C230.5)%22%3E%3Cline%20stroke%3D%22currentColor%22%20x2%3D%22-6%22%3E%3C%2Fline%3E%3Ctext%20fill%3D%22currentColor%22%20x%3D%22-9%22%20dy%3D%220.32em%22%3E0%3C%2Ftext%3E%3C%2Fg%3E%3Cg%20class%3D%22tick%22%20opacity%3D%221%22%20transform%3D%22translate(0%2C200.67789533737877)%22%3E%3Cline%20stroke%3D%22currentColor%22%20x2%3D%22-6%22%3E%3C%2Fline%3E%3Ctext%20fill%3D%22currentColor%22%20x%3D%22-9%22%20dy%3D%220.32em%22%3E5%2C000%3C%2Ftext%3E%3C%2Fg%3E%3Cg%20class%3D%22tick%22%20opacity%3D%221%22%20transform%3D%22translate(0%2C170.85579067475754)%22%3E%3Cline%20stroke%3D%22currentColor%22%20x2%3D%22-6%22%3E%3C%2Fline%3E%3Ctext%20fill%3D%22currentColor%22%20x%3D%22-9%22%20dy%3D%220.32em%22%3E10%2C000%3C%2Ftext%3E%3C%2Fg%3E%3Cg%20class%3D%22tick%22%20opacity%3D%221%22%20transform%3D%22translate(0%2C141.03368601213631)%22%3E%3Cline%20stroke%3D%22currentColor%22%20x2%3D%22-6%22%3E%3C%2Fline%3E%3Ctext%20fill%3D%22currentColor%22%20x%3D%22-9%22%20dy%3D%220.32em%22%3E15%2C000%3C%2Ftext%3E%3C%2Fg%3E%3Cg%20class%3D%22tick%22%20opacity%3D%221%22%20transform%3D%22translate(0%2C111.21158134951509)%22%3E%3Cline%20stroke%3D%22currentColor%22%20x2%3D%22-6%22%3E%3C%2Fline%3E%3Ctext%20fill%3D%22currentColor%22%20x%3D%22-9%22%20dy%3D%220.32em%22%3E20%2C000%3C%2Ftext%3E%3C%2Fg%3E%3Cg%20class%3D%22tick%22%20opacity%3D%221%22%20transform%3D%22translate(0%2C81.38947668689383)%22%3E%3Cline%20stroke%3D%22currentColor%22%20x2%3D%22-6%22%3E%3C%2Fline%3E%3Ctext%20fill%3D%22currentColor%22%20x%3D%22-9%22%20dy%3D%220.32em%22%3E25%2C000%3C%2Ftext%3E%3C%2Fg%3E%3Cg%20class%3D%22tick%22%20opacity%3D%221%22%20transform%3D%22translate(0%2C51.56737202427261)%22%3E%3Cline%20stroke%3D%22currentColor%22%20x2%3D%22-6%22%3E%3C%2Fline%3E%3Ctext%20fill%3D%22currentColor%22%20x%3D%22-9%22%20dy%3D%220.32em%22%3E30%2C000%3C%2Ftext%3E%3C%2Fg%3E%3Cg%20class%3D%22tick%22%20opacity%3D%221%22%20transform%3D%22translate(0%2C21.745267361651358)%22%3E%3Cline%20stroke%3D%22currentColor%22%20x2%3D%22-6%22%3E%3C%2Fline%3E%3Ctext%20fill%3D%22currentColor%22%20x%3D%22-9%22%20dy%3D%220.32em%22%3E35%2C000%3C%2Ftext%3E%3C%2Fg%3E%3C%2Fg%3E%3Cpath%20fill%3D%22%2318cfae%22%20fill-opacity%3D%220.1%22%20d%3D%22M0%2C61.82122296561381L33.63636363636364%2C69.47357502204241L67.27272727272728%2C65.04201026917691L100.9090909090909%2C60.49115709766092L134.54545454545456%2C64.30242207354391L168.1818181818182%2C50.101135833203685L201.8181818181818%2C66.23489445568175L235.45454545454544%2C42.96172397697216L269.0909090909091%2C51.08526528707018L302.72727272727275%2C36.28753695347751L336.3636363636364%2C2.0935117473160068L370%2C226.61817333125876L370%2C230L336.3636363636364%2C230L302.72727272727275%2C230L269.0909090909091%2C230L235.45454545454544%2C230L201.8181818181818%2C230L168.1818181818182%2C230L134.54545454545456%2C230L100.9090909090909%2C230L67.27272727272728%2C230L33.63636363636364%2C230L0%2C230Z%22%3E%3C%2Fpath%3E%3Cpath%20fill%3D%22none%22%20stroke%3D%22%2318cfae%22%20stroke-width%3D%222%22%20d%3D%22M0%2C61.82122296561381L33.63636363636364%2C69.47357502204241L67.27272727272728%2C65.04201026917691L100.9090909090909%2C60.49115709766092L134.54545454545456%2C64.30242207354391L168.1818181818182%2C50.101135833203685L201.8181818181818%2C66.23489445568175L235.45454545454544%2C42.96172397697216L269.0909090909091%2C51.08526528707018L302.72727272727275%2C36.28753695347751L336.3636363636364%2C2.0935117473160068L370%2C226.61817333125876%22%3E%3C%2Fpath%3E%3Ccircle%20cx%3D%220%22%20cy%3D%2261.82122296561381%22%20r%3D%224%22%20fill%3D%22white%22%20stroke%3D%22%2318cfae%22%20stroke-width%3D%222%22%3E%3C%2Fcircle%3E%3Ccircle%20cx%3D%2233.63636363636364%22%20cy%3D%2269.47357502204241%22%20r%3D%224%22%20fill%3D%22white%22%20stroke%3D%22%2318cfae%22%20stroke-width%3D%222%22%3E%3C%2Fcircle%3E%3Ccircle%20cx%3D%2267.27272727272728%22%20cy%3D%2265.04201026917691%22%20r%3D%224%22%20fill%3D%22white%22%20stroke%3D%22%2318cfae%22%20stroke-width%3D%222%22%3E%3C%2Fcircle%3E%3Ccircle%20cx%3D%22100.9090909090909%22%20cy%3D%2260.49115709766092%22%20r%3D%224%22%20fill%3D%22white%22%20stroke%3D%22%2318cfae%22%20stroke-width%3D%222%22%3E%3C%2Fcircle%3E%3Ccircle%20cx%3D%22134.54545454545456%22%20cy%3D%2264.30242207354391%22%20r%3D%224%22%20fill%3D%22white%22%20stroke%3D%22%2318cfae%22%20stroke-width%3D%222%22%3E%3C%2Fcircle%3E%3Ccircle%20cx%3D%22168.1818181818182%22%20cy%3D%2250.101135833203685%22%20r%3D%224%22%20fill%3D%22white%22%20stroke%3D%22%2318cfae%22%20stroke-width%3D%222%22%3E%3C%2Fcircle%3E%3Ccircle%20cx%3D%22201.8181818181818%22%20cy%3D%2266.23489445568175%22%20r%3D%224%22%20fill%3D%22white%22%20stroke%3D%22%2318cfae%22%20stroke-width%3D%222%22%3E%3C%2Fcircle%3E%3Ccircle%20cx%3D%22235.45454545454544%22%20cy%3D%2242.96172397697216%22%20r%3D%224%22%20fill%3D%22white%22%20stroke%3D%22%2318cfae%22%20stroke-width%3D%222%22%3E%3C%2Fcircle%3E%3Ccircle%20cx%3D%22269.0909090909091%22%20cy%3D%2251.08526528707018%22%20r%3D%224%22%20fill%3D%22white%22%20stroke%3D%22%2318cfae%22%20stroke-width%3D%222%22%3E%3C%2Fcircle%3E%3Ccircle%20cx%3D%22302.72727272727275%22%20cy%3D%2236.28753695347751%22%20r%3D%224%22%20fill%3D%22white%22%20stroke%3D%22%2318cfae%22%20stroke-width%3D%222%22%3E%3C%2Fcircle%3E%3Ccircle%20cx%3D%22336.3636363636364%22%20cy%3D%222.0935117473160068%22%20r%3D%224%22%20fill%3D%22white%22%20stroke%3D%22%2318cfae%22%20stroke-width%3D%222%22%3E%3C%2Fcircle%3E%3Ccircle%20cx%3D%22370%22%20cy%3D%22226.61817333125876%22%20r%3D%224%22%20fill%3D%22white%22%20stroke%3D%22%2318cfae%22%20stroke-width%3D%222%22%3E%3C%2Fcircle%3E%3Cpath%20fill%3D%22%23434348%22%20fill-opacity%3D%220.1%22%20d%3D%22M0%2C48.6100306000726L33.63636363636364%2C36.60365126290129L67.27272727272728%2C26.034697370468347L100.9090909090909%2C20.195529277527097L134.54545454545456%2C22.05642860847466L168.1818181818182%2C0L201.8181818181818%2C9.030133291841716L235.45454545454544%2C11.213111353145575L269.0909090909091%2C21.215445256988758L302.72727272727275%2C0.24454125823349493L336.3636363636364%2C5.785488304548516L370%2C226.7792126964369L370%2C230L336.3636363636364%2C230L302.72727272727275%2C230L269.0909090909091%2C230L235.45454545454544%2C230L201.8181818181818%2C230L168.1818181818182%2C230L134.54545454545456%2C230L100.9090909090909%2C230L67.27272727272728%2C230L33.63636363636364%2C230L0%2C230Z%22%3E%3C%2Fpath%3E%3Cpath%20fill%3D%22none%22%20stroke%3D%22%23434348%22%20stroke-width%3D%222%22%20d%3D%22M0%2C48.6100306000726L33.63636363636364%2C36.60365126290129L67.27272727272728%2C26.034697370468347L100.9090909090909%2C20.195529277527097L134.54545454545456%2C22.05642860847466L168.1818181818182%2C0L201.8181818181818%2C9.030133291841716L235.45454545454544%2C11.213111353145575L269.0909090909091%2C21.215445256988758L302.72727272727275%2C0.24454125823349493L336.3636363636364%2C5.785488304548516L370%2C226.7792126964369%22%3E%3C%2Fpath%3E%3Ccircle%20cx%3D%220%22%20cy%3D%2248.6100306000726%22%20r%3D%224%22%20fill%3D%22white%22%20stroke%3D%22%23434348%22%20stroke-width%3D%222%22%3E%3C%2Fcircle%3E%3Ccircle%20cx%3D%2233.63636363636364%22%20cy%3D%2236.60365126290129%22%20r%3D%224%22%20fill%3D%22white%22%20stroke%3D%22%23434348%22%20stroke-width%3D%222%22%3E%3C%2Fcircle%3E%3Ccircle%20cx%3D%2267.27272727272728%22%20cy%3D%2226.034697370468347%22%20r%3D%224%22%20fill%3D%22white%22%20stroke%3D%22%23434348%22%20stroke-width%3D%222%22%3E%3C%2Fcircle%3E%3Ccircle%20cx%3D%22100.9090909090909%22%20cy%3D%2220.195529277527097%22%20r%3D%224%22%20fill%3D%22white%22%20stroke%3D%22%23434348%22%20stroke-width%3D%222%22%3E%3C%2Fcircle%3E%3Ccircle%20cx%3D%22134.54545454545456%22%20cy%3D%2222.05642860847466%22%20r%3D%224%22%20fill%3D%22white%22%20stroke%3D%22%23434348%22%20stroke-width%3D%222%22%3E%3C%2Fcircle%3E%3Ccircle%20cx%3D%22168.1818181818182%22%20cy%3D%220%22%20r%3D%224%22%20fill%3D%22white%22%20stroke%3D%22%23434348%22%20stroke-width%3D%222%22%3E%3C%2Fcircle%3E%3Ccircle%20cx%3D%22201.8181818181818%22%20cy%3D%229.030133291841716%22%20r%3D%224%22%20fill%3D%22white%22%20stroke%3D%22%23434348%22%20stroke-width%3D%222%22%3E%3C%2Fcircle%3E%3Ccircle%20cx%3D%22235.45454545454544%22%20cy%3D%2211.213111353145575%22%20r%3D%224%22%20fill%3D%22white%22%20stroke%3D%22%23434348%22%20stroke-width%3D%222%22%3E%3C%2Fcircle%3E%3Ccircle%20cx%3D%22269.0909090909091%22%20cy%3D%2221.215445256988758%22%20r%3D%224%22%20fill%3D%22white%22%20stroke%3D%22%23434348%22%20stroke-width%3D%222%22%3E%3C%2Fcircle%3E%3Ccircle%20cx%3D%22302.72727272727275%22%20cy%3D%220.24454125823349493%22%20r%3D%224%22%20fill%3D%22white%22%20stroke%3D%22%23434348%22%20stroke-width%3D%222%22%3E%3C%2Fcircle%3E%3Ccircle%20cx%3D%22336.3636363636364%22%20cy%3D%225.785488304548516%22%20r%3D%224%22%20fill%3D%22white%22%20stroke%3D%22%23434348%22%20stroke-width%3D%222%22%3E%3C%2Fcircle%3E%3Ccircle%20cx%3D%22370%22%20cy%3D%22226.7792126964369%22%20r%3D%224%22%20fill%3D%22white%22%20stroke%3D%22%23434348%22%20stroke-width%3D%222%22%3E%3C%2Fcircle%3E%3Ctext%20x%3D%22185%22%20y%3D%22-10%22%20text-anchor%3D%22middle%22%20style%3D%22font-size%3A%2016px%3B%20font-weight%3A%20bold%3B%20font-family%3A%20poppins%3B%22%3E%3C%2Ftext%3E%3C%2Fg%3E%3C%2Fsvg%3E)
%22%3E%3Cpath%20fill%3D%22rgba(0%2C%20192%2C%20163%2C%200.3)%22%20stroke%3D%22none%22%20d%3D%22M0%2C247.80487911278036L113%2C245.60620842996903L226%2C215.63442887723645L339%2C198.70639461033252L452%2C235.92219498146153L565%2C233.23147130730163L678%2C148.49137108844602L791%2C72.2927633610457L904%2C66.8816345893451L1017%2C0L1130%2C50.29536437753607L1130%2C250L1017%2C250L904%2C250L791%2C250L678%2C250L565%2C250L452%2C250L339%2C250L226%2C250L113%2C250L0%2C250Z%22%3E%3C%2Fpath%3E%3Cpath%20fill%3D%22none%22%20stroke%3D%22%2300C0A3%22%20stroke-width%3D%222%22%20d%3D%22M0%2C247.80487911278036L113%2C245.60620842996903L226%2C215.63442887723645L339%2C198.70639461033252L452%2C235.92219498146153L565%2C233.23147130730163L678%2C148.49137108844602L791%2C72.2927633610457L904%2C66.8816345893451L1017%2C0L1130%2C50.29536437753607%22%3E%3C%2Fpath%3E%3Ccircle%20cx%3D%220%22%20cy%3D%22247.80487911278036%22%20r%3D%223%22%20fill%3D%22%2300C0A3%22%20stroke%3D%22%2300C0A3%22%3E%3C%2Fcircle%3E%3Ccircle%20cx%3D%22113%22%20cy%3D%22245.60620842996903%22%20r%3D%223%22%20fill%3D%22%2300C0A3%22%20stroke%3D%22%2300C0A3%22%3E%3C%2Fcircle%3E%3Ccircle%20cx%3D%22226%22%20cy%3D%22215.63442887723645%22%20r%3D%223%22%20fill%3D%22%2300C0A3%22%20stroke%3D%22%2300C0A3%22%3E%3C%2Fcircle%3E%3Ccircle%20cx%3D%22339%22%20cy%3D%22198.70639461033252%22%20r%3D%223%22%20fill%3D%22%2300C0A3%22%20stroke%3D%22%2300C0A3%22%3E%3C%2Fcircle%3E%3Ccircle%20cx%3D%22452%22%20cy%3D%22235.92219498146153%22%20r%3D%223%22%20fill%3D%22%2300C0A3%22%20stroke%3D%22%2300C0A3%22%3E%3C%2Fcircle%3E%3Ccircle%20cx%3D%22565%22%20cy%3D%22233.23147130730163%22%20r%3D%223%22%20fill%3D%22%2300C0A3%22%20stroke%3D%22%2300C0A3%22%3E%3C%2Fcircle%3E%3Ccircle%20cx%3D%22678%22%20cy%3D%22148.49137108844602%22%20r%3D%223%22%20fill%3D%22%2300C0A3%22%20stroke%3D%22%2300C0A3%22%3E%3C%2Fcircle%3E%3Ccircle%20cx%3D%22791%22%20cy%3D%2272.2927633610457%22%20r%3D%223%22%20fill%3D%22%2300C0A3%22%20stroke%3D%22%2300C0A3%22%3E%3C%2Fcircle%3E%3Ccircle%20cx%3D%22904%22%20cy%3D%2266.8816345893451%22%20r%3D%223%22%20fill%3D%22%2300C0A3%22%20stroke%3D%22%2300C0A3%22%3E%3C%2Fcircle%3E%3Ccircle%20cx%3D%221017%22%20cy%3D%220%22%20r%3D%223%22%20fill%3D%22%2300C0A3%22%20stroke%3D%22%2300C0A3%22%3E%3C%2Fcircle%3E%3Ccircle%20cx%3D%221130%22%20cy%3D%2250.29536437753607%22%20r%3D%223%22%20fill%3D%22%2300C0A3%22%20stroke%3D%22%2300C0A3%22%3E%3C%2Fcircle%3E%3Ctext%20x%3D%22565%22%20y%3D%22-10%22%20text-anchor%3D%22middle%22%20style%3D%22font-size%3A%2016px%3B%20font-weight%3A%20bold%3B%22%3E%3C%2Ftext%3E%3C%2Fg%3E%3C%2Fsvg%3E)
%22%3E%3Cg%20transform%3D%22translate(0%2C380)%22%20fill%3D%22none%22%20font-size%3D%2210%22%20font-family%3D%22sans-serif%22%20text-anchor%3D%22middle%22%3E%3Cpath%20class%3D%22domain%22%20stroke%3D%22currentColor%22%20d%3D%22M0.5%2C6V0.5H450.5V6%22%3E%3C%2Fpath%3E%3Cg%20class%3D%22tick%22%20opacity%3D%221%22%20transform%3D%22translate(0.5%2C0)%22%3E%3Cline%20stroke%3D%22currentColor%22%20y2%3D%226%22%3E%3C%2Fline%3E%3Ctext%20fill%3D%22currentColor%22%20y%3D%229%22%20dy%3D%220.71em%22%20style%3D%22font-size%3A%2012px%3B%22%3E0%3C%2Ftext%3E%3C%2Fg%3E%3Cg%20class%3D%22tick%22%20opacity%3D%221%22%20transform%3D%22translate(72.5087562647618%2C0)%22%3E%3Cline%20stroke%3D%22currentColor%22%20y2%3D%226%22%3E%3C%2Fline%3E%3Ctext%20fill%3D%22currentColor%22%20y%3D%229%22%20dy%3D%220.71em%22%20style%3D%22font-size%3A%2012px%3B%22%3E100%2C000%3C%2Ftext%3E%3C%2Fg%3E%3Cg%20class%3D%22tick%22%20opacity%3D%221%22%20transform%3D%22translate(144.5175125295236%2C0)%22%3E%3Cline%20stroke%3D%22currentColor%22%20y2%3D%226%22%3E%3C%2Fline%3E%3Ctext%20fill%3D%22currentColor%22%20y%3D%229%22%20dy%3D%220.71em%22%20style%3D%22font-size%3A%2012px%3B%22%3E200%2C000%3C%2Ftext%3E%3C%2Fg%3E%3Cg%20class%3D%22tick%22%20opacity%3D%221%22%20transform%3D%22translate(216.5262687942854%2C0)%22%3E%3Cline%20stroke%3D%22currentColor%22%20y2%3D%226%22%3E%3C%2Fline%3E%3Ctext%20fill%3D%22currentColor%22%20y%3D%229%22%20dy%3D%220.71em%22%20style%3D%22font-size%3A%2012px%3B%22%3E300%2C000%3C%2Ftext%3E%3C%2Fg%3E%3Cg%20class%3D%22tick%22%20opacity%3D%221%22%20transform%3D%22translate(288.5350250590472%2C0)%22%3E%3Cline%20stroke%3D%22currentColor%22%20y2%3D%226%22%3E%3C%2Fline%3E%3Ctext%20fill%3D%22currentColor%22%20y%3D%229%22%20dy%3D%220.71em%22%20style%3D%22font-size%3A%2012px%3B%22%3E400%2C000%3C%2Ftext%3E%3C%2Fg%3E%3Cg%20class%3D%22tick%22%20opacity%3D%221%22%20transform%3D%22translate(360.54378132380896%2C0)%22%3E%3Cline%20stroke%3D%22currentColor%22%20y2%3D%226%22%3E%3C%2Fline%3E%3Ctext%20fill%3D%22currentColor%22%20y%3D%229%22%20dy%3D%220.71em%22%20style%3D%22font-size%3A%2012px%3B%22%3E500%2C000%3C%2Ftext%3E%3C%2Fg%3E%3Cg%20class%3D%22tick%22%20opacity%3D%221%22%20transform%3D%22translate(432.5525375885708%2C0)%22%3E%3Cline%20stroke%3D%22currentColor%22%20y2%3D%226%22%3E%3C%2Fline%3E%3Ctext%20fill%3D%22currentColor%22%20y%3D%229%22%20dy%3D%220.71em%22%20style%3D%22font-size%3A%2012px%3B%22%3E600%2C000%3C%2Ftext%3E%3C%2Fg%3E%3C%2Fg%3E%3Cg%20fill%3D%22none%22%20font-size%3D%2210%22%20font-family%3D%22sans-serif%22%20text-anchor%3D%22end%22%3E%3Cpath%20class%3D%22domain%22%20stroke%3D%22currentColor%22%20d%3D%22M-6%2C0.5H0.5V380.5H-6%22%3E%3C%2Fpath%3E%3Cg%20class%3D%22tick%22%20opacity%3D%221%22%20transform%3D%22translate(0%2C20.693069306930685)%22%3E%3Cline%20stroke%3D%22currentColor%22%20x2%3D%22-6%22%3E%3C%2Fline%3E%3Ctext%20fill%3D%22currentColor%22%20x%3D%22-9%22%20dy%3D%220.32em%22%20style%3D%22font-size%3A%2012px%3B%22%3ENISSAN%20PHI%20...%3C%2Ftext%3E%3C%2Fg%3E%3Cg%20class%3D%22tick%22%20opacity%3D%221%22%20transform%3D%22translate(0%2C58.3168316831683)%22%3E%3Cline%20stroke%3D%22currentColor%22%20x2%3D%22-6%22%3E%3C%2Fline%3E%3Ctext%20fill%3D%22currentColor%22%20x%3D%22-9%22%20dy%3D%220.32em%22%20style%3D%22font-size%3A%2012px%3B%22%3ESUZUKI%20PHI%20...%3C%2Ftext%3E%3C%2Fg%3E%3Cg%20class%3D%22tick%22%20opacity%3D%221%22%20transform%3D%22translate(0%2C95.94059405940592)%22%3E%3Cline%20stroke%3D%22currentColor%22%20x2%3D%22-6%22%3E%3C%2Fline%3E%3Ctext%20fill%3D%22currentColor%22%20x%3D%22-9%22%20dy%3D%220.32em%22%20style%3D%22font-size%3A%2012px%3B%22%3EKAWASAKI%20M%20...%3C%2Ftext%3E%3C%2Fg%3E%3Cg%20class%3D%22tick%22%20opacity%3D%221%22%20transform%3D%22translate(0%2C133.56435643564356)%22%3E%3Cline%20stroke%3D%22currentColor%22%20x2%3D%22-6%22%3E%3C%2Fline%3E%3Ctext%20fill%3D%22currentColor%22%20x%3D%22-9%22%20dy%3D%220.32em%22%20style%3D%22font-size%3A%2012px%3B%22%3EYAMAHA%20MOT%20...%3C%2Ftext%3E%3C%2Fg%3E%3Cg%20class%3D%22tick%22%20opacity%3D%221%22%20transform%3D%22translate(0%2C171.18811881188117)%22%3E%3Cline%20stroke%3D%22currentColor%22%20x2%3D%22-6%22%3E%3C%2Fline%3E%3Ctext%20fill%3D%22currentColor%22%20x%3D%22-9%22%20dy%3D%220.32em%22%20style%3D%22font-size%3A%2012px%3B%22%3EHYUNDAI%20AS%20...%3C%2Ftext%3E%3C%2Fg%3E%3Cg%20class%3D%22tick%22%20opacity%3D%221%22%20transform%3D%22translate(0%2C208.81188118811878)%22%3E%3Cline%20stroke%3D%22currentColor%22%20x2%3D%22-6%22%3E%3C%2Fline%3E%3Ctext%20fill%3D%22currentColor%22%20x%3D%22-9%22%20dy%3D%220.32em%22%20style%3D%22font-size%3A%2012px%3B%22%3ETMX%20PHILIP%20...%3C%2Ftext%3E%3C%2Fg%3E%3Cg%20class%3D%22tick%22%20opacity%3D%221%22%20transform%3D%22translate(0%2C246.4356435643564)%22%3E%3Cline%20stroke%3D%22currentColor%22%20x2%3D%22-6%22%3E%3C%2Fline%3E%3Ctext%20fill%3D%22currentColor%22%20x%3D%22-9%22%20dy%3D%220.32em%22%20style%3D%22font-size%3A%2012px%3B%22%3EAMERICAN%20P%20...%3C%2Ftext%3E%3C%2Fg%3E%3Cg%20class%3D%22tick%22%20opacity%3D%221%22%20transform%3D%22translate(0%2C284.05940594059405)%22%3E%3Cline%20stroke%3D%22currentColor%22%20x2%3D%22-6%22%3E%3C%2Fline%3E%3Ctext%20fill%3D%22currentColor%22%20x%3D%22-9%22%20dy%3D%220.32em%22%20style%3D%22font-size%3A%2012px%3B%22%3ESILK%20ROAD%20%20...%3C%2Ftext%3E%3C%2Fg%3E%3Cg%20class%3D%22tick%22%20opacity%3D%221%22%20transform%3D%22translate(0%2C321.68316831683165)%22%3E%3Cline%20stroke%3D%22currentColor%22%20x2%3D%22-6%22%3E%3C%2Fline%3E%3Ctext%20fill%3D%22currentColor%22%20x%3D%22-9%22%20dy%3D%220.32em%22%20style%3D%22font-size%3A%2012px%3B%22%3ETASCO%20INC%20...%3C%2Ftext%3E%3C%2Fg%3E%3Cg%20class%3D%22tick%22%20opacity%3D%221%22%20transform%3D%22translate(0%2C359.30693069306926)%22%3E%3Cline%20stroke%3D%22currentColor%22%20x2%3D%22-6%22%3E%3C%2Fline%3E%3Ctext%20fill%3D%22currentColor%22%20x%3D%22-9%22%20dy%3D%220.32em%22%20style%3D%22font-size%3A%2012px%3B%22%3EH%26amp%3BM%20Hennes%20...%3C%2Ftext%3E%3C%2Fg%3E%3C%2Fg%3E%3Crect%20class%3D%22bar%22%20y%3D%223.762376237623755%22%20width%3D%22450%22%20height%3D%2233.86138613861386%22%20fill%3D%22%2300d8bc%22%3E%3C%2Frect%3E%3Crect%20class%3D%22bar%22%20y%3D%2241.38613861386138%22%20width%3D%22173.38556368454402%22%20height%3D%2233.86138613861386%22%20fill%3D%22%2300d8bc%22%3E%3C%2Frect%3E%3Crect%20class%3D%22bar%22%20y%3D%2279.009900990099%22%20width%3D%22124.20358315571173%22%20height%3D%2233.86138613861386%22%20fill%3D%22%2300d8bc%22%3E%3C%2Frect%3E%3Crect%20class%3D%22bar%22%20y%3D%22116.63366336633662%22%20width%3D%2272.9146264185725%22%20height%3D%2233.86138613861386%22%20fill%3D%22%2300d8bc%22%3E%3C%2Frect%3E%3Crect%20class%3D%22bar%22%20y%3D%22154.25742574257424%22%20width%3D%2229.264358545999198%22%20height%3D%2233.86138613861386%22%20fill%3D%22%2300d8bc%22%3E%3C%2Frect%3E%3Crect%20class%3D%22bar%22%20y%3D%22191.88118811881185%22%20width%3D%2222.182297367359872%22%20height%3D%2233.86138613861386%22%20fill%3D%22%2300d8bc%22%3E%3C%2Frect%3E%3Crect%20class%3D%22bar%22%20y%3D%22229.50495049504948%22%20width%3D%2221.04023849300075%22%20height%3D%2233.86138613861386%22%20fill%3D%22%2300d8bc%22%3E%3C%2Frect%3E%3Crect%20class%3D%22bar%22%20y%3D%22267.1287128712871%22%20width%3D%2217.10784031338211%22%20height%3D%2233.86138613861386%22%20fill%3D%22%2300d8bc%22%3E%3C%2Frect%3E%3Crect%20class%3D%22bar%22%20y%3D%22304.7524752475247%22%20width%3D%2213.50020162451754%22%20height%3D%2233.86138613861386%22%20fill%3D%22%2300d8bc%22%3E%3C%2Frect%3E%3Crect%20class%3D%22bar%22%20y%3D%22342.37623762376234%22%20width%3D%2212.443113082550838%22%20height%3D%2233.86138613861386%22%20fill%3D%22%2300d8bc%22%3E%3C%2Frect%3E%3Ctext%20x%3D%22225%22%20y%3D%22-10%22%20text-anchor%3D%22middle%22%20style%3D%22font-size%3A%2016px%3B%20font-weight%3A%20bold%3B%20font-family%3A%20poppins%3B%22%3E%3C%2Ftext%3E%3C%2Fg%3E%3C%2Fsvg%3E)
%22%3E%3Cg%20transform%3D%22translate(0%2C380)%22%20fill%3D%22none%22%20font-size%3D%2210%22%20font-family%3D%22sans-serif%22%20text-anchor%3D%22middle%22%3E%3Cpath%20class%3D%22domain%22%20stroke%3D%22currentColor%22%20d%3D%22M0.5%2C6V0.5H450.5V6%22%3E%3C%2Fpath%3E%3Cg%20class%3D%22tick%22%20opacity%3D%221%22%20transform%3D%22translate(0.5%2C0)%22%3E%3Cline%20stroke%3D%22currentColor%22%20y2%3D%226%22%3E%3C%2Fline%3E%3Ctext%20fill%3D%22currentColor%22%20y%3D%229%22%20dy%3D%220.71em%22%20style%3D%22font-size%3A%2012px%3B%22%3E0%3C%2Ftext%3E%3C%2Fg%3E%3Cg%20class%3D%22tick%22%20opacity%3D%221%22%20transform%3D%22translate(73.41880021674709%2C0)%22%3E%3Cline%20stroke%3D%22currentColor%22%20y2%3D%226%22%3E%3C%2Fline%3E%3Ctext%20fill%3D%22currentColor%22%20y%3D%229%22%20dy%3D%220.71em%22%20style%3D%22font-size%3A%2012px%3B%22%3E2%2C000%2C000%3C%2Ftext%3E%3C%2Fg%3E%3Cg%20class%3D%22tick%22%20opacity%3D%221%22%20transform%3D%22translate(146.33760043349417%2C0)%22%3E%3Cline%20stroke%3D%22currentColor%22%20y2%3D%226%22%3E%3C%2Fline%3E%3Ctext%20fill%3D%22currentColor%22%20y%3D%229%22%20dy%3D%220.71em%22%20style%3D%22font-size%3A%2012px%3B%22%3E4%2C000%2C000%3C%2Ftext%3E%3C%2Fg%3E%3Cg%20class%3D%22tick%22%20opacity%3D%221%22%20transform%3D%22translate(219.25640065024123%2C0)%22%3E%3Cline%20stroke%3D%22currentColor%22%20y2%3D%226%22%3E%3C%2Fline%3E%3Ctext%20fill%3D%22currentColor%22%20y%3D%229%22%20dy%3D%220.71em%22%20style%3D%22font-size%3A%2012px%3B%22%3E6%2C000%2C000%3C%2Ftext%3E%3C%2Fg%3E%3Cg%20class%3D%22tick%22%20opacity%3D%221%22%20transform%3D%22translate(292.17520086698835%2C0)%22%3E%3Cline%20stroke%3D%22currentColor%22%20y2%3D%226%22%3E%3C%2Fline%3E%3Ctext%20fill%3D%22currentColor%22%20y%3D%229%22%20dy%3D%220.71em%22%20style%3D%22font-size%3A%2012px%3B%22%3E8%2C000%2C000%3C%2Ftext%3E%3C%2Fg%3E%3Cg%20class%3D%22tick%22%20opacity%3D%221%22%20transform%3D%22translate(365.0940010837354%2C0)%22%3E%3Cline%20stroke%3D%22currentColor%22%20y2%3D%226%22%3E%3C%2Fline%3E%3Ctext%20fill%3D%22currentColor%22%20y%3D%229%22%20dy%3D%220.71em%22%20style%3D%22font-size%3A%2012px%3B%22%3E10%2C000%2C000%3C%2Ftext%3E%3C%2Fg%3E%3Cg%20class%3D%22tick%22%20opacity%3D%221%22%20transform%3D%22translate(438.01280130048247%2C0)%22%3E%3Cline%20stroke%3D%22currentColor%22%20y2%3D%226%22%3E%3C%2Fline%3E%3Ctext%20fill%3D%22currentColor%22%20y%3D%229%22%20dy%3D%220.71em%22%20style%3D%22font-size%3A%2012px%3B%22%3E12%2C000%2C000%3C%2Ftext%3E%3C%2Fg%3E%3C%2Fg%3E%3Cg%20fill%3D%22none%22%20font-size%3D%2210%22%20font-family%3D%22sans-serif%22%20text-anchor%3D%22end%22%3E%3Cpath%20class%3D%22domain%22%20stroke%3D%22currentColor%22%20d%3D%22M-6%2C0.5H0.5V380.5H-6%22%3E%3C%2Fpath%3E%3Cg%20class%3D%22tick%22%20opacity%3D%221%22%20transform%3D%22translate(0%2C22.967032967032967)%22%3E%3Cline%20stroke%3D%22currentColor%22%20x2%3D%22-6%22%3E%3C%2Fline%3E%3Ctext%20fill%3D%22currentColor%22%20x%3D%22-9%22%20dy%3D%220.32em%22%20style%3D%22font-size%3A%2012px%3B%22%3EUsed%20Plast%20...%3C%2Ftext%3E%3C%2Fg%3E%3Cg%20class%3D%22tick%22%20opacity%3D%221%22%20transform%3D%22translate(0%2C64.72527472527473)%22%3E%3Cline%20stroke%3D%22currentColor%22%20x2%3D%22-6%22%3E%3C%2Fline%3E%3Ctext%20fill%3D%22currentColor%22%20x%3D%22-9%22%20dy%3D%220.32em%22%20style%3D%22font-size%3A%2012px%3B%22%3EAutomobile%20...%3C%2Ftext%3E%3C%2Fg%3E%3Cg%20class%3D%22tick%22%20opacity%3D%221%22%20transform%3D%22translate(0%2C106.48351648351648)%22%3E%3Cline%20stroke%3D%22currentColor%22%20x2%3D%22-6%22%3E%3C%2Fline%3E%3Ctext%20fill%3D%22currentColor%22%20x%3D%22-9%22%20dy%3D%220.32em%22%20style%3D%22font-size%3A%2012px%3B%22%3EPRESENTER%20%20...%3C%2Ftext%3E%3C%2Fg%3E%3Cg%20class%3D%22tick%22%20opacity%3D%221%22%20transform%3D%22translate(0%2C148.24175824175825)%22%3E%3Cline%20stroke%3D%22currentColor%22%20x2%3D%22-6%22%3E%3C%2Fline%3E%3Ctext%20fill%3D%22currentColor%22%20x%3D%22-9%22%20dy%3D%220.32em%22%20style%3D%22font-size%3A%2012px%3B%22%3EWHEELERS%20C%20...%3C%2Ftext%3E%3C%2Fg%3E%3Cg%20class%3D%22tick%22%20opacity%3D%221%22%20transform%3D%22translate(0%2C190)%22%3E%3Cline%20stroke%3D%22currentColor%22%20x2%3D%22-6%22%3E%3C%2Fline%3E%3Ctext%20fill%3D%22currentColor%22%20x%3D%22-9%22%20dy%3D%220.32em%22%20style%3D%22font-size%3A%2012px%3B%22%3EAutomotive%20...%3C%2Ftext%3E%3C%2Fg%3E%3Cg%20class%3D%22tick%22%20opacity%3D%221%22%20transform%3D%22translate(0%2C231.75824175824175)%22%3E%3Cline%20stroke%3D%22currentColor%22%20x2%3D%22-6%22%3E%3C%2Fline%3E%3Ctext%20fill%3D%22currentColor%22%20x%3D%22-9%22%20dy%3D%220.32em%22%20style%3D%22font-size%3A%2012px%3B%22%3EREINFORCEM%20...%3C%2Ftext%3E%3C%2Fg%3E%3Cg%20class%3D%22tick%22%20opacity%3D%221%22%20transform%3D%22translate(0%2C273.51648351648356)%22%3E%3Cline%20stroke%3D%22currentColor%22%20x2%3D%22-6%22%3E%3C%2Fline%3E%3Ctext%20fill%3D%22currentColor%22%20x%3D%22-9%22%20dy%3D%220.32em%22%20style%3D%22font-size%3A%2012px%3B%22%3EComponent%20%20...%3C%2Ftext%3E%3C%2Fg%3E%3Cg%20class%3D%22tick%22%20opacity%3D%221%22%20transform%3D%22translate(0%2C315.2747252747253)%22%3E%3Cline%20stroke%3D%22currentColor%22%20x2%3D%22-6%22%3E%3C%2Fline%3E%3Ctext%20fill%3D%22currentColor%22%20x%3D%22-9%22%20dy%3D%220.32em%22%20style%3D%22font-size%3A%2012px%3B%22%3EBicycle%20Se%20...%3C%2Ftext%3E%3C%2Fg%3E%3Cg%20class%3D%22tick%22%20opacity%3D%221%22%20transform%3D%22translate(0%2C357.03296703296706)%22%3E%3Cline%20stroke%3D%22currentColor%22%20x2%3D%22-6%22%3E%3C%2Fline%3E%3Ctext%20fill%3D%22currentColor%22%20x%3D%22-9%22%20dy%3D%220.32em%22%20style%3D%22font-size%3A%2012px%3B%22%3EFLAP%20MOTOR%20...%3C%2Ftext%3E%3C%2Fg%3E%3C%2Fg%3E%3Crect%20class%3D%22bar%22%20y%3D%224.175824175824175%22%20width%3D%22450%22%20height%3D%2237.582417582417584%22%20fill%3D%22%2300d8bc%22%3E%3C%2Frect%3E%3Crect%20class%3D%22bar%22%20y%3D%2245.934065934065934%22%20width%3D%22149.7938463986539%22%20height%3D%2237.582417582417584%22%20fill%3D%22%2300d8bc%22%3E%3C%2Frect%3E%3Crect%20class%3D%22bar%22%20y%3D%2287.6923076923077%22%20width%3D%2283.15043812856007%22%20height%3D%2237.582417582417584%22%20fill%3D%22%2300d8bc%22%3E%3C%2Frect%3E%3Crect%20class%3D%22bar%22%20y%3D%22129.45054945054946%22%20width%3D%2277.91548808279946%22%20height%3D%2237.582417582417584%22%20fill%3D%22%2300d8bc%22%3E%3C%2Frect%3E%3Crect%20class%3D%22bar%22%20y%3D%22171.2087912087912%22%20width%3D%2254.76621179378952%22%20height%3D%2237.582417582417584%22%20fill%3D%22%2300d8bc%22%3E%3C%2Frect%3E%3Crect%20class%3D%22bar%22%20y%3D%22212.96703296703296%22%20width%3D%2212.411764200693279%22%20height%3D%2237.582417582417584%22%20fill%3D%22%2300d8bc%22%3E%3C%2Frect%3E%3Crect%20class%3D%22bar%22%20y%3D%22254.72527472527474%22%20width%3D%2210.806165138720726%22%20height%3D%2237.582417582417584%22%20fill%3D%22%2300d8bc%22%3E%3C%2Frect%3E%3Crect%20class%3D%22bar%22%20y%3D%22296.4835164835165%22%20width%3D%222.1396198953599015%22%20height%3D%2237.582417582417584%22%20fill%3D%22%2300d8bc%22%3E%3C%2Frect%3E%3Crect%20class%3D%22bar%22%20y%3D%22338.24175824175825%22%20width%3D%220.37899546412654295%22%20height%3D%2237.582417582417584%22%20fill%3D%22%2300d8bc%22%3E%3C%2Frect%3E%3Ctext%20x%3D%22225%22%20y%3D%22-10%22%20text-anchor%3D%22middle%22%20style%3D%22font-size%3A%2016px%3B%20font-weight%3A%20bold%3B%20font-family%3A%20poppins%3B%22%3E%3C%2Ftext%3E%3C%2Fg%3E%3C%2Fsvg%3E)
%22%3E%3Cg%20transform%3D%22translate(0%2C380)%22%20fill%3D%22none%22%20font-size%3D%2210%22%20font-family%3D%22sans-serif%22%20text-anchor%3D%22middle%22%3E%3Cpath%20class%3D%22domain%22%20stroke%3D%22currentColor%22%20d%3D%22M0.5%2C6V0.5H450.5V6%22%3E%3C%2Fpath%3E%3Cg%20class%3D%22tick%22%20opacity%3D%221%22%20transform%3D%22translate(0.5%2C0)%22%3E%3Cline%20stroke%3D%22currentColor%22%20y2%3D%226%22%3E%3C%2Fline%3E%3Ctext%20fill%3D%22currentColor%22%20y%3D%229%22%20dy%3D%220.71em%22%20style%3D%22font-size%3A%2012px%3B%22%3E0%3C%2Ftext%3E%3C%2Fg%3E%3Cg%20class%3D%22tick%22%20opacity%3D%221%22%20transform%3D%22translate(84.52648963094445%2C0)%22%3E%3Cline%20stroke%3D%22currentColor%22%20y2%3D%226%22%3E%3C%2Fline%3E%3Ctext%20fill%3D%22currentColor%22%20y%3D%229%22%20dy%3D%220.71em%22%20style%3D%22font-size%3A%2012px%3B%22%3E500%2C000%3C%2Ftext%3E%3C%2Fg%3E%3Cg%20class%3D%22tick%22%20opacity%3D%221%22%20transform%3D%22translate(168.5529792618889%2C0)%22%3E%3Cline%20stroke%3D%22currentColor%22%20y2%3D%226%22%3E%3C%2Fline%3E%3Ctext%20fill%3D%22currentColor%22%20y%3D%229%22%20dy%3D%220.71em%22%20style%3D%22font-size%3A%2012px%3B%22%3E1%2C000%2C000%3C%2Ftext%3E%3C%2Fg%3E%3Cg%20class%3D%22tick%22%20opacity%3D%221%22%20transform%3D%22translate(252.57946889283335%2C0)%22%3E%3Cline%20stroke%3D%22currentColor%22%20y2%3D%226%22%3E%3C%2Fline%3E%3Ctext%20fill%3D%22currentColor%22%20y%3D%229%22%20dy%3D%220.71em%22%20style%3D%22font-size%3A%2012px%3B%22%3E1%2C500%2C000%3C%2Ftext%3E%3C%2Fg%3E%3Cg%20class%3D%22tick%22%20opacity%3D%221%22%20transform%3D%22translate(336.6059585237778%2C0)%22%3E%3Cline%20stroke%3D%22currentColor%22%20y2%3D%226%22%3E%3C%2Fline%3E%3Ctext%20fill%3D%22currentColor%22%20y%3D%229%22%20dy%3D%220.71em%22%20style%3D%22font-size%3A%2012px%3B%22%3E2%2C000%2C000%3C%2Ftext%3E%3C%2Fg%3E%3Cg%20class%3D%22tick%22%20opacity%3D%221%22%20transform%3D%22translate(420.6324481547222%2C0)%22%3E%3Cline%20stroke%3D%22currentColor%22%20y2%3D%226%22%3E%3C%2Fline%3E%3Ctext%20fill%3D%22currentColor%22%20y%3D%229%22%20dy%3D%220.71em%22%20style%3D%22font-size%3A%2012px%3B%22%3E2%2C500%2C000%3C%2Ftext%3E%3C%2Fg%3E%3C%2Fg%3E%3Cg%20fill%3D%22none%22%20font-size%3D%2210%22%20font-family%3D%22sans-serif%22%20text-anchor%3D%22end%22%3E%3Cpath%20class%3D%22domain%22%20stroke%3D%22currentColor%22%20d%3D%22M-6%2C0.5H0.5V380.5H-6%22%3E%3C%2Fpath%3E%3Cg%20class%3D%22tick%22%20opacity%3D%221%22%20transform%3D%22translate(0%2C190)%22%3E%3Cline%20stroke%3D%22currentColor%22%20x2%3D%22-6%22%3E%3C%2Fline%3E%3Ctext%20fill%3D%22currentColor%22%20x%3D%22-9%22%20dy%3D%220.32em%22%20style%3D%22font-size%3A%2012px%3B%22%3EIndia%20...%3C%2Ftext%3E%3C%2Fg%3E%3C%2Fg%3E%3Crect%20class%3D%22bar%22%20y%3D%2234.54545454545456%22%20width%3D%22450%22%20height%3D%22310.9090909090909%22%20fill%3D%22%2300d8bc%22%3E%3C%2Frect%3E%3Ctext%20x%3D%22225%22%20y%3D%22-10%22%20text-anchor%3D%22middle%22%20style%3D%22font-size%3A%2016px%3B%20font-weight%3A%20bold%3B%20font-family%3A%20poppins%3B%22%3E%3C%2Ftext%3E%3C%2Fg%3E%3C%2Fsvg%3E)
%22%3E%3Cg%20transform%3D%22translate(0%2C380)%22%20fill%3D%22none%22%20font-size%3D%2210%22%20font-family%3D%22sans-serif%22%20text-anchor%3D%22middle%22%3E%3Cpath%20class%3D%22domain%22%20stroke%3D%22currentColor%22%20d%3D%22M0.5%2C6V0.5H450.5V6%22%3E%3C%2Fpath%3E%3Cg%20class%3D%22tick%22%20opacity%3D%221%22%20transform%3D%22translate(0.5%2C0)%22%3E%3Cline%20stroke%3D%22currentColor%22%20y2%3D%226%22%3E%3C%2Fline%3E%3Ctext%20fill%3D%22currentColor%22%20y%3D%229%22%20dy%3D%220.71em%22%20style%3D%22font-size%3A%2012px%3B%22%3E0%3C%2Ftext%3E%3C%2Fg%3E%3Cg%20class%3D%22tick%22%20opacity%3D%221%22%20transform%3D%22translate(130.6530484157771%2C0)%22%3E%3Cline%20stroke%3D%22currentColor%22%20y2%3D%226%22%3E%3C%2Fline%3E%3Ctext%20fill%3D%22currentColor%22%20y%3D%229%22%20dy%3D%220.71em%22%20style%3D%22font-size%3A%2012px%3B%22%3E500%2C000%3C%2Ftext%3E%3C%2Fg%3E%3Cg%20class%3D%22tick%22%20opacity%3D%221%22%20transform%3D%22translate(260.8060968315542%2C0)%22%3E%3Cline%20stroke%3D%22currentColor%22%20y2%3D%226%22%3E%3C%2Fline%3E%3Ctext%20fill%3D%22currentColor%22%20y%3D%229%22%20dy%3D%220.71em%22%20style%3D%22font-size%3A%2012px%3B%22%3E1%2C000%2C000%3C%2Ftext%3E%3C%2Fg%3E%3Cg%20class%3D%22tick%22%20opacity%3D%221%22%20transform%3D%22translate(390.95914524733126%2C0)%22%3E%3Cline%20stroke%3D%22currentColor%22%20y2%3D%226%22%3E%3C%2Fline%3E%3Ctext%20fill%3D%22currentColor%22%20y%3D%229%22%20dy%3D%220.71em%22%20style%3D%22font-size%3A%2012px%3B%22%3E1%2C500%2C000%3C%2Ftext%3E%3C%2Fg%3E%3C%2Fg%3E%3Cg%20fill%3D%22none%22%20font-size%3D%2210%22%20font-family%3D%22sans-serif%22%20text-anchor%3D%22end%22%3E%3Cpath%20class%3D%22domain%22%20stroke%3D%22currentColor%22%20d%3D%22M-6%2C0.5H0.5V380.5H-6%22%3E%3C%2Fpath%3E%3Cg%20class%3D%22tick%22%20opacity%3D%221%22%20transform%3D%22translate(0%2C20.693069306930685)%22%3E%3Cline%20stroke%3D%22currentColor%22%20x2%3D%22-6%22%3E%3C%2Fline%3E%3Ctext%20fill%3D%22currentColor%22%20x%3D%22-9%22%20dy%3D%220.32em%22%20style%3D%22font-size%3A%2012px%3B%22%3EManila%20...%3C%2Ftext%3E%3C%2Fg%3E%3Cg%20class%3D%22tick%22%20opacity%3D%221%22%20transform%3D%22translate(0%2C58.3168316831683)%22%3E%3Cline%20stroke%3D%22currentColor%22%20x2%3D%22-6%22%3E%3C%2Fline%3E%3Ctext%20fill%3D%22currentColor%22%20x%3D%22-9%22%20dy%3D%220.32em%22%20style%3D%22font-size%3A%2012px%3B%22%3EManila%20Nor%20...%3C%2Ftext%3E%3C%2Fg%3E%3Cg%20class%3D%22tick%22%20opacity%3D%221%22%20transform%3D%22translate(0%2C95.94059405940592)%22%3E%3Cline%20stroke%3D%22currentColor%22%20x2%3D%22-6%22%3E%3C%2Fline%3E%3Ctext%20fill%3D%22currentColor%22%20x%3D%22-9%22%20dy%3D%220.32em%22%20style%3D%22font-size%3A%2012px%3B%22%3ECebu%20...%3C%2Ftext%3E%3C%2Fg%3E%3Cg%20class%3D%22tick%22%20opacity%3D%221%22%20transform%3D%22translate(0%2C133.56435643564356)%22%3E%3Cline%20stroke%3D%22currentColor%22%20x2%3D%22-6%22%3E%3C%2Fline%3E%3Ctext%20fill%3D%22currentColor%22%20x%3D%22-9%22%20dy%3D%220.32em%22%20style%3D%22font-size%3A%2012px%3B%22%3EManila%20Sou%20...%3C%2Ftext%3E%3C%2Fg%3E%3Cg%20class%3D%22tick%22%20opacity%3D%221%22%20transform%3D%22translate(0%2C171.18811881188117)%22%3E%3Cline%20stroke%3D%22currentColor%22%20x2%3D%22-6%22%3E%3C%2Fline%3E%3Ctext%20fill%3D%22currentColor%22%20x%3D%22-9%22%20dy%3D%220.32em%22%20style%3D%22font-size%3A%2012px%3B%22%3EBatangas%20...%3C%2Ftext%3E%3C%2Fg%3E%3Cg%20class%3D%22tick%22%20opacity%3D%221%22%20transform%3D%22translate(0%2C208.81188118811878)%22%3E%3Cline%20stroke%3D%22currentColor%22%20x2%3D%22-6%22%3E%3C%2Fline%3E%3Ctext%20fill%3D%22currentColor%22%20x%3D%22-9%22%20dy%3D%220.32em%22%20style%3D%22font-size%3A%2012px%3B%22%3EThoothibar%20...%3C%2Ftext%3E%3C%2Fg%3E%3Cg%20class%3D%22tick%22%20opacity%3D%221%22%20transform%3D%22translate(0%2C246.4356435643564)%22%3E%3Cline%20stroke%3D%22currentColor%22%20x2%3D%22-6%22%3E%3C%2Fline%3E%3Ctext%20fill%3D%22currentColor%22%20x%3D%22-9%22%20dy%3D%220.32em%22%20style%3D%22font-size%3A%2012px%3B%22%3EDavid%20City%20...%3C%2Ftext%3E%3C%2Fg%3E%3Cg%20class%3D%22tick%22%20opacity%3D%221%22%20transform%3D%22translate(0%2C284.05940594059405)%22%3E%3Cline%20stroke%3D%22currentColor%22%20x2%3D%22-6%22%3E%3C%2Fline%3E%3Ctext%20fill%3D%22currentColor%22%20x%3D%22-9%22%20dy%3D%220.32em%22%20style%3D%22font-size%3A%2012px%3B%22%3ESubic%20Bay%20...%3C%2Ftext%3E%3C%2Fg%3E%3Cg%20class%3D%22tick%22%20opacity%3D%221%22%20transform%3D%22translate(0%2C321.68316831683165)%22%3E%3Cline%20stroke%3D%22currentColor%22%20x2%3D%22-6%22%3E%3C%2Fline%3E%3Ctext%20fill%3D%22currentColor%22%20x%3D%22-9%22%20dy%3D%220.32em%22%20style%3D%22font-size%3A%2012px%3B%22%3ESantos%20...%3C%2Ftext%3E%3C%2Fg%3E%3Cg%20class%3D%22tick%22%20opacity%3D%221%22%20transform%3D%22translate(0%2C359.30693069306926)%22%3E%3Cline%20stroke%3D%22currentColor%22%20x2%3D%22-6%22%3E%3C%2Fline%3E%3Ctext%20fill%3D%22currentColor%22%20x%3D%22-9%22%20dy%3D%220.32em%22%20style%3D%22font-size%3A%2012px%3B%22%3ENinoy%20Aqui%20...%3C%2Ftext%3E%3C%2Fg%3E%3C%2Fg%3E%3Crect%20class%3D%22bar%22%20y%3D%223.762376237623755%22%20width%3D%22450%22%20height%3D%2233.86138613861386%22%20fill%3D%22%2300d8bc%22%3E%3C%2Frect%3E%3Crect%20class%3D%22bar%22%20y%3D%2241.38613861386138%22%20width%3D%22117.1806940801766%22%20height%3D%2233.86138613861386%22%20fill%3D%22%2300d8bc%22%3E%3C%2Frect%3E%3Crect%20class%3D%22bar%22%20y%3D%2279.009900990099%22%20width%3D%2231.948668794620804%22%20height%3D%2233.86138613861386%22%20fill%3D%22%2300d8bc%22%3E%3C%2Frect%3E%3Crect%20class%3D%22bar%22%20y%3D%22116.63366336633662%22%20width%3D%2230.269434163960447%22%20height%3D%2233.86138613861386%22%20fill%3D%22%2300d8bc%22%3E%3C%2Frect%3E%3Crect%20class%3D%22bar%22%20y%3D%22154.25742574257424%22%20width%3D%2223.253143629962736%22%20height%3D%2233.86138613861386%22%20fill%3D%22%2300d8bc%22%3E%3C%2Frect%3E%3Crect%20class%3D%22bar%22%20y%3D%22191.88118811881185%22%20width%3D%2212.33043950081389%22%20height%3D%2233.86138613861386%22%20fill%3D%22%2300d8bc%22%3E%3C%2Frect%3E%3Crect%20class%3D%22bar%22%20y%3D%22229.50495049504948%22%20width%3D%2212.25833471199155%22%20height%3D%2233.86138613861386%22%20fill%3D%22%2300d8bc%22%3E%3C%2Frect%3E%3Crect%20class%3D%22bar%22%20y%3D%22267.1287128712871%22%20width%3D%227.846406676793538%22%20height%3D%2233.86138613861386%22%20fill%3D%22%2300d8bc%22%3E%3C%2Frect%3E%3Crect%20class%3D%22bar%22%20y%3D%22304.7524752475247%22%20width%3D%222.199846824323464%22%20height%3D%2233.86138613861386%22%20fill%3D%22%2300d8bc%22%3E%3C%2Frect%3E%3Crect%20class%3D%22bar%22%20y%3D%22342.37623762376234%22%20width%3D%221.7544630926446754%22%20height%3D%2233.86138613861386%22%20fill%3D%22%2300d8bc%22%3E%3C%2Frect%3E%3Ctext%20x%3D%22225%22%20y%3D%22-10%22%20text-anchor%3D%22middle%22%20style%3D%22font-size%3A%2016px%3B%20font-weight%3A%20bold%3B%20font-family%3A%20poppins%3B%22%3E%3C%2Ftext%3E%3C%2Fg%3E%3C%2Fsvg%3E)